Social Media Analysis: How to Measure Social Media Success
Let’s be real—succeeding on social media takes more than just posting content and hoping for the best. To win on social media, you need to know what’s working, what isn’t, and why. Social media analysis is the secret weapon that helps you get there. We’re not talking about vanity metrics—this is about finding data that drives your goals.
In this guide, let’s break down exactly how to measure what matters, so you can make strategic moves that push your brand forward, every single day.
Let’s dive right in!
Setting the Foundation
Don’t just “set goals”; make them matter. Tie each social goal to a business objective. If you’re not connecting those dots, you’re flying blind. This is where your roadmap to measurable success starts.
Aligning Metrics with Business Objectives
To accurately gauge social media success, start by setting clear, measurable objectives tied to overarching business goals. This creates a framework for identifying the most relevant metrics, ensuring data is actionable.
For example:
- Brand Awareness goals should focus on metrics like reach, impressions, and new followers.
- Lead Generation goals benefit from tracking conversion rates, click-through rates, and lead form completions.
- Customer Loyalty goals are best monitored through engagement rates, audience retention, and sentiment.
Insight: A recent survey by Sprout Social shows that 74% of social marketers say aligning social KPIs with business goals significantly improves client satisfaction.
Establishing Baselines and Setting Benchmarks
Use industry-specific benchmarks as reference points. These are essential for contextualizing your metrics.
A few ways to set and apply benchmarks include:
- Historical Performance: Compare current metrics to last quarter’s data to understand trends.
- Competitive Analysis: Use tools like Sprout Social or Rival IQ to assess competitor benchmarks.
Pro Tip: Create a baseline report before launching new campaigns to have a clear comparison metric.
Core Social Media Metrics Every Brand Should Track
Metrics are your mirror. From reach to engagement, these are the stats that tell you if your content’s resonating or if it’s time for a pivot.
Here’s how to read them to boost your strategy:
1. Reach and Impressions
Understanding the difference between reach (unique viewers) and impressions (total views, including repeats) is crucial. A high reach with low engagement often indicates a need for better-targeted or more compelling content.
- Platform-Specific Metrics: Facebook and Instagram analytics offer insights on reach and impressions per post. Use this data to refine content timing and format.
Recommended Action: Identify top-performing content based on reach and replicate similar themes or styles to maximize visibility.
2. Engagement Metrics
Engagement is a telltale sign of content resonance. Core engagement metrics include:
- Likes and Reactions: Gauge initial interest and emotional responses.
- Comments and Shares: Measure deeper engagement and willingness to amplify content.
- Saves and Clicks: Indicate long-term interest and intent to take action.
Statistic: Posts with high engagement are shared 70% more frequently than low-engagement posts, underscoring the value of this metric.
3. Audience Growth Rate
Beyond follower counts, growth rate measures the velocity of your follower base. A steady growth rate of 1-2% monthly suggests effective content and audience alignment.
- Monitor Over Time: Use growth rate analysis to detect seasonal trends or impacts of campaign adjustments.
Pro Insight: Identify what type of content sparks growth and strategize accordingly (e.g., interactive content may drive faster growth).
Advanced Metrics for Experienced Marketers
These are the metrics the pros watch—virality rates, customer lifetime value—that show whether your strategy has staying power. Measure these, and you’re not just playing; you’re competing.
Virality Rate
Virality rate, calculated as (shares ÷ impressions) × 100, gives insight into how well your content resonates enough to be shared. A rate above 1% often indicates content with strong viral potential.
For example, Nike’s Instagram campaigns achieve virality by leveraging timely content, like event-specific posts or user-generated stories, leading to 3x higher shares than standard posts.
Customer Lifetime Value (CLV) from Social Channels
Understanding CLV helps in calculating long-term profitability from social audiences. Brands can target high-value customers with retention campaigns, increasing loyalty through personalized offers.
Tip: Track CLV through Google Analytics by tagging social-driven conversions, allowing you to measure the financial impact of social engagement.
Case Study: Starbucks’ loyalty program integrates social media, encouraging CLV growth by 25% for high-engagement customers.
Essential Tools for Social Media Analysis
Analytics tools are your behind-the-scenes MVPs, helping you track, tweak, and tune your performance in real-time. We’re covering the best-in-class here.
Analytics Platforms
Every platform has unique capabilities.
Here are tools favored by social media experts:
- Sprout Social: Provides in-depth audience segmentation and competitive analysis.
- Brandwatch: Delivers robust sentiment analysis and trend predictions.
Hootsuite Analytics: Excellent for multi-platform tracking, with customizable dashboards to visualize data in real-time.
AI-Driven Insights and Predictive Analytics
Using tools like Sprinklr and Talkwalker, brands can predict emerging trends by analyzing historical data, which is invaluable for forward-thinking content strategies.
Competitive Analysis Techniques
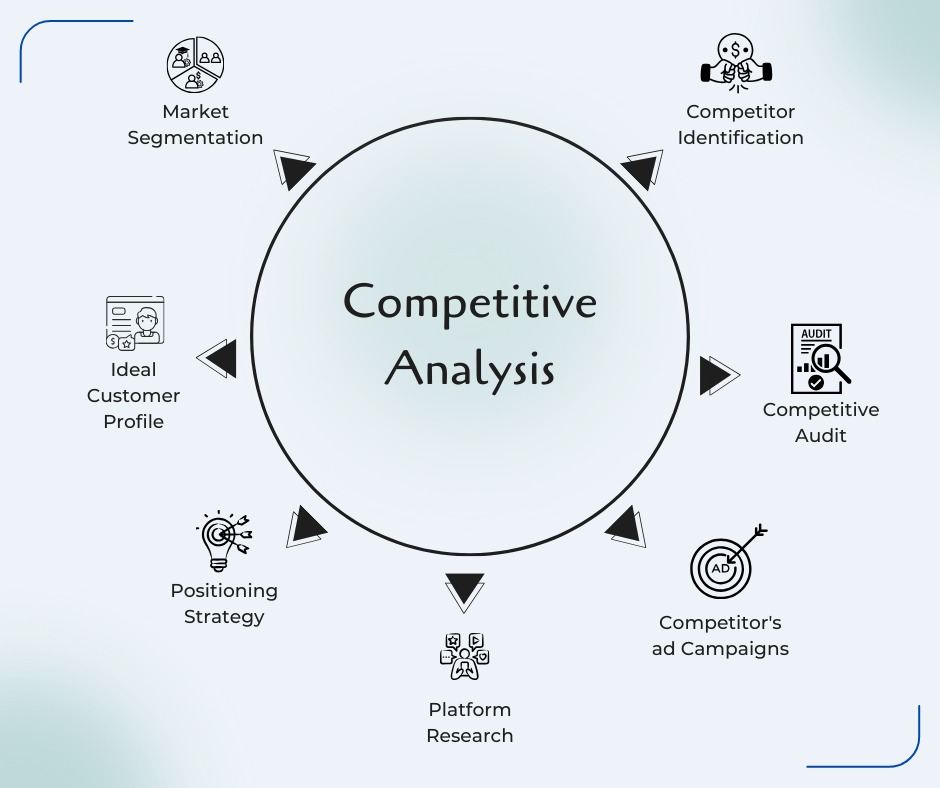
Your competitors are your best case studies. Break down their tactics and KPIs to figure out what’s working in your industry. This is how you make their wins your learnings.

Analyzing Competitor Content and Engagement
Evaluate competitors’ top-performing posts and engagement patterns. Tools like Socialbakers can help track which types of posts—videos, carousels, or stories—perform best for your competition.
Mapping Competitor KPIs to Spot Trends
Keeping tabs on competitor KPIs not only helps benchmark performance but also uncovers patterns. For instance, if competitor engagement rises following user-generated content, this might signal a growing preference for authenticity in your industry.
Advanced Strategy: Set up a Google Sheet to track competitors’ weekly engagement and virality metrics, identifying content categories with peak engagement.
From Data to Actionable Insights
Data is just the start; action is the goal. All these numbers mean nothing if you don’t turn them into strategies that get results. We’ll show you how to convert metrics into moves that matter.
Implementing A/B Testing
Running A/B tests on social content (e.g., image vs. video) is a great way to optimize for CTR and engagement. Facebook found that experimenting with CTAs alone could boost engagement by over 20%.
Suggested Action: Start with A/B tests on headline variations to learn what style resonates most with your audience, and then apply findings to content strategy.
Refining Content Based on Analysis
Data-driven insights allow for refined content strategies.
For instance:
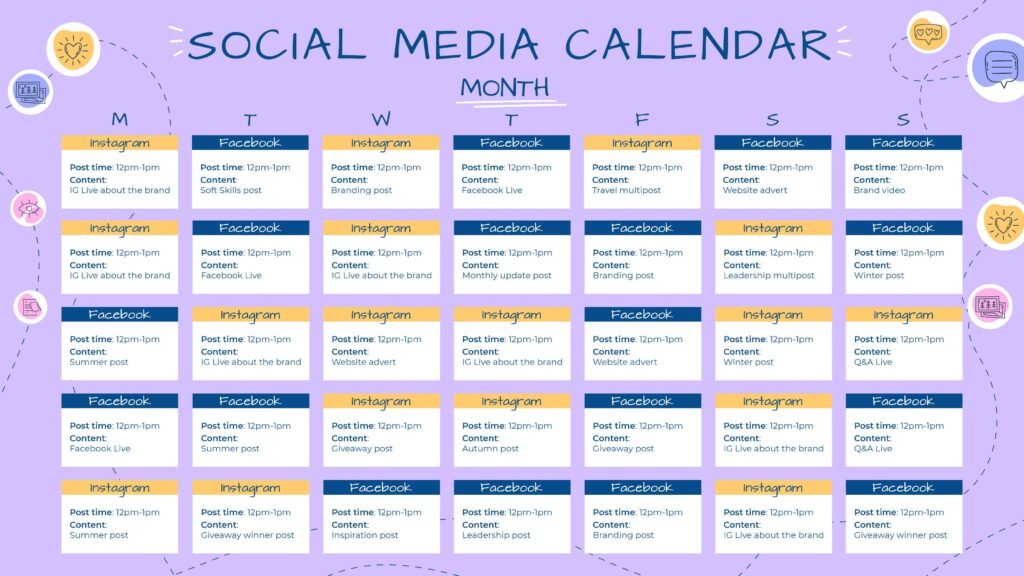
- Content Timing: Post when engagement rates are highest.
Content Format: Use data to determine if carousels or reels have higher engagement.

Final Thoughts
Social media isn’t just about being active; it’s about being smart with your actions. With effective analysis, you’ll know exactly what to improve, amplify, or pivot, setting you apart from the competition. Use these insights to move with purpose, adapt fast, and keep your brand relevant.
Ready to take your social strategy to the next level? Dive deeper with our tools and services designed for growth-driven brands like yours. Let’s connect, and we’ll help you turn those metrics into meaningful results.

